Analytics and BI for SaaS: What to Measure First
How to build analytics for a SaaS product that people actually use: start from decisions, define metrics precisely, instrument events carefully and keep dashboards few.
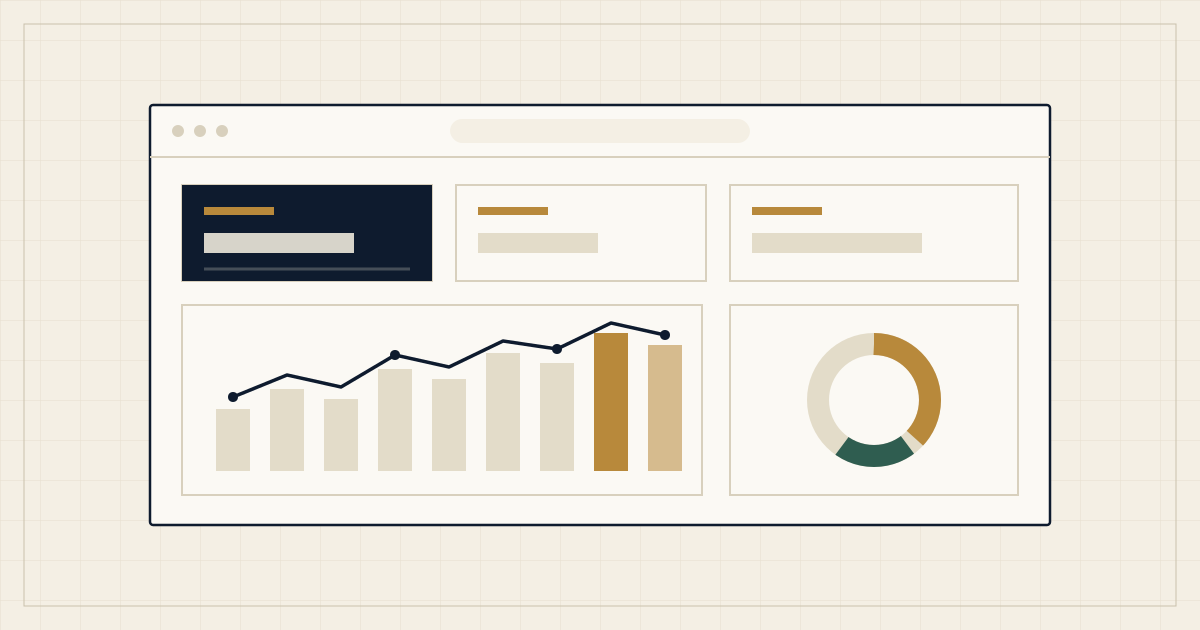
Many SaaS teams collect plenty of data and still struggle to answer simple questions. Which customers are getting value? Where do new users get stuck? Is this feature worth maintaining? Dashboards multiply, nobody opens them, and two reports show two different numbers for the same thing.
Good analytics is less about tools and more about discipline: asking clear questions, defining terms precisely and keeping the system small enough to trust.
Start with decisions, not data
Before you track anything, list the decisions the numbers should inform. For each decision, write the question behind it.
- Should we invest in onboarding or in new features this quarter? Where do new accounts stall before they get value?
- Is a feature worth maintaining? Who uses it, how often and does it relate to retention?
- Which customers need a conversation from our team? Which accounts show declining usage?
- Can we afford to hire? What does recurring revenue look like once churn is taken into account?
If you cannot connect a metric to a decision, it is a candidate for removal. This one rule prevents most dashboard clutter.
Three audiences, three kinds of reporting
“Analytics” covers several different jobs, and mixing them causes confusion.
- Product analytics answers how people use the product: which features, which paths, where they drop off. The audience is product and design.
- Business intelligence (BI) answers how the business performs: revenue, customers, costs, pipeline. The audience is leadership, finance and sales.
- Operational reporting answers what is happening now: open support tickets, failed jobs, items waiting for review. The audience is the team doing the work.
They overlap, but they have different freshness needs, different owners and different tolerances for detail. Be clear about which one you are building before you choose tools and design screens.
Define metrics precisely, in writing
Most disagreements about numbers are disagreements about definitions. “Active user” might mean someone who logged in, someone who completed a key action or someone who belongs to a paying account. Each is reasonable, and each gives a different answer.
For every metric, write down:
- Name and purpose: what decision it informs.
- Exact definition: including what counts and what does not.
- Time window: per day, week, month or rolling period.
- Source: where the data comes from.
- Owner: the person who can answer questions about it.
Keep this in a shared document and treat changes like changes to code: review them and note the date.
A starter set to adapt
The right metrics depend on your product and model, but most SaaS products need to understand a handful of areas. Treat the list below as prompts for your own definitions.
- Acquisition: where new sign-ups come from, in a form you can act on.
- Activation: the first moment a new account gets real value, expressed as a specific action you can observe. Defining this moment is often the most valuable exercise in the whole process.
- Engagement: how deeply and how often accounts use the core features, not just whether they log in.
- Retention: whether accounts and users keep coming back over time, usually viewed by cohort (the group that signed up in the same period).
- Revenue: recurring revenue, expansion, contraction and churn, defined consistently with finance.
- Support and quality: volume and themes of support requests, error rates and performance, because they often explain changes in the other areas.
Resist the urge to track everything at once. Begin with activation and retention, which tend to reveal the most about whether the product delivers value.
Instrument events deliberately
Product analytics depends on events: records of meaningful actions such as “created a project” or “invited a teammate”. Poorly planned events are the main reason analytics projects disappoint.
- Write a tracking plan. A simple table listing each event, when it fires, its properties and why it exists.
- Use consistent names. Pick a convention (for example, object plus past-tense verb) and stick to it.
- Track accounts, not only users. In B2B SaaS, the customer is usually an account with several users. Attach both identifiers to events so you can see usage at either level.
- Capture the moments that matter, not every click. A short list of well-chosen events beats a flood of noise.
- Test events like features. Verify that they fire once, with the right properties, before you rely on them.
Build a foundation you can trust
You do not need a large data platform on day one. A sensible path is to begin with the reporting built into your product database and the tools you already use, then add structure as questions outgrow them.
When you do need a central store, whether a warehouse or a simple reporting database, aim for one principle: a single, documented source for each number. If finance, sales and product each compute churn separately, you will spend more time reconciling than deciding.
Plan for data quality too. Check for missing or duplicate records, monitor that data keeps arriving, and make it obvious when a report is stale.
Design dashboards people will open
- Few and owned. Every dashboard has an owner and a purpose. If nobody owns it, retire it.
- Lead with the question. Put the question at the top and the answer directly beneath it, instead of a wall of charts.
- Show change, not only totals. A total can rise while the health of the business falls. Pair totals with trends and cohorts.
- Add context. Annotate releases, campaigns and incidents so that people can see why a line moved.
- Make it accessible. Do not rely on colour alone, and keep text readable.
- Link to action. A good dashboard leads to a decision, a conversation or a ticket.
Analytics as a product feature
Some products go further and give customers their own reports and dashboards. This can be a real advantage, but it needs careful design.
- Tenant isolation: each customer must only ever see their own data. Enforce this in the data layer, not only in the interface.
- Permissions: decide which roles may see which reports and exports.
- Performance: reports that are fast for ten records can be slow for ten million. Test with realistic volumes.
- Meaning: customers will make decisions from your numbers, so definitions need to be clear within the product.
Privacy and responsibility
Collect only what you need, tell people what you collect and why, and keep personal data out of analytics when you can. Check which laws and contracts apply to you, and involve legal advice where required. Analytics that people do not trust is analytics they eventually turn off.
A short checklist
- List the decisions the data should support.
- Write precise definitions for a small set of metrics.
- Draft a tracking plan and instrument only what you need.
- Choose one source of truth per number.
- Build a few dashboards, each with an owner and a question.
- Review quarterly: retire what nobody uses and add what decisions require.
If you would like help shaping analytics for your product, from the tracking plan to dashboards, contact us and tell us which decisions you want to make with better data.